Step 1 is determining what most popular means to you. Is it posts that have done well in search over the last year, posts that have gained the most social media traffic, or posts that have been viewed the most?
Determine Your Time Frame
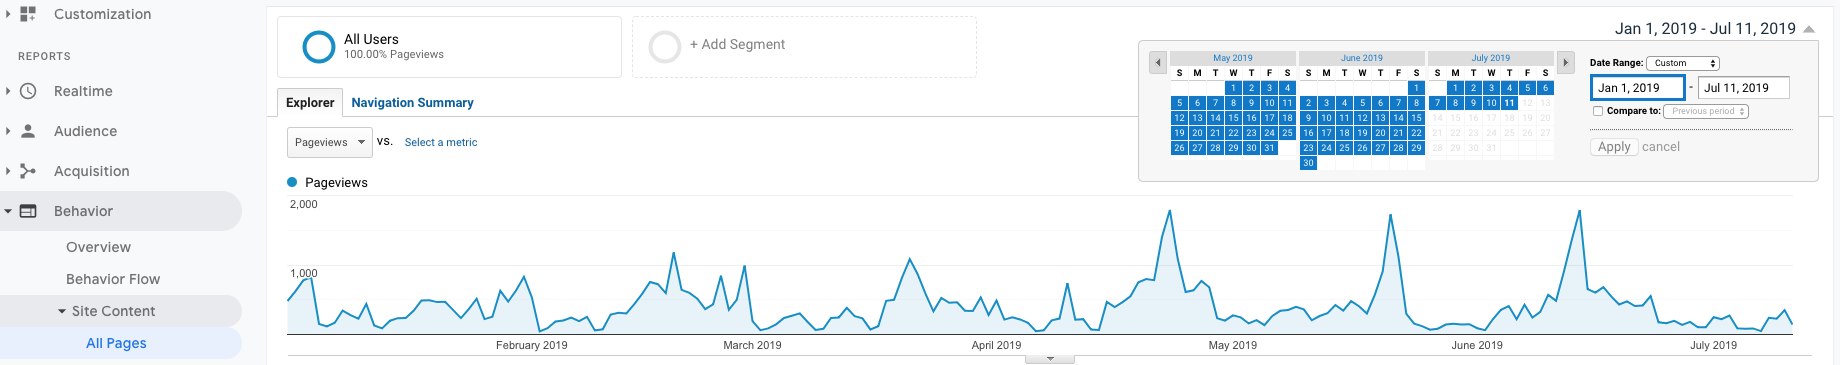
For our “best of” blog we wanted to consider all of the content that was viewed this year. So step one was to change our time frame in Google Analytics. We set our start date at 1/1/2019 and our end date to the latest date possible.
View All Pages
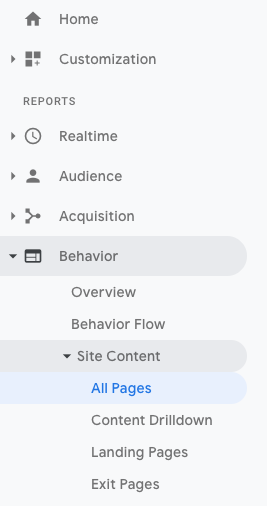
Now you can view what pages on your site received the most page views for the year. To do this you scroll to the Behavior Section. Then click on Site Content. Finally click on All Pages.
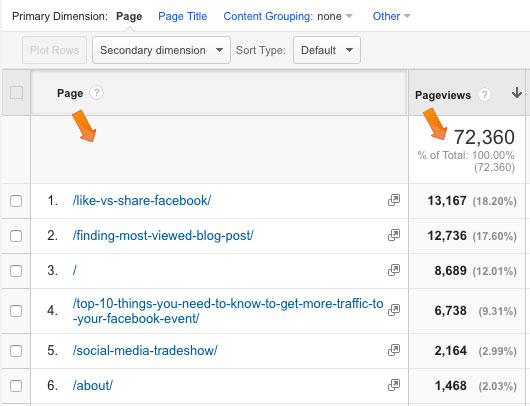
This will generate a report that will show you all of your content and the total amount of pageviews that content has received. A pageview simply means that the page has been loaded by a browser. This is a pretty basic measure of popularity but it is an easy and quick way to come up with your top posts compilation.
Your report should looks something like the report below. At this point you would need to just look through the list of pages and decide which ones you would like to feature. You may have to decide if you want to only feature content that was published in the past year or if you want to feature whatever content was viewed most this year.
Pro Tip
This is also a great opportunity to assess your content. Do you see anything on your list that is really old and irrelevant? Maybe that can be reworked before next year. Do you see something that has really outperformed the rest? Maybe that is the kind of content that your audience will crave next year. Be sure to use this time and this information to guide your decisions for the coming year.